前言
在 H5 中,开发者可以通过熟悉的 Echarts 配置方式,快速开发图表,满足各种可视化需求。同样在微信小程序中,官方也提供了 Echarts 对应的微信版本。但当我们信心满满使用 Taro 框架做跨端开发时,却会发现好像并没有对应的 Echarts 跨端组件可供选择。
在 Taro 社区物料中,存在少量对单个端能力适配的 Echarts 组件,实现逻辑都是引用了 Echarts 官方微信版本,所以必然会存在部分微信小程序环境的限制。为了尽量对更多端的小程序做跨端适配,我们可以对 Echarts 官方微信版本的部分 Api 调用逻辑或者限制条件判断逻辑做一些调整。
echarts4taro3
基于 Taro 3.x 框架构建的 h5 和微信小程序、GMU 小程序版本 Echarts 跨端组件,及使用示例。
小程序基础库 > 2.9.0 (主要为了提升各端兼容性)
1
2
3
4
5
6
7
8
9
10
11
12
13
14
15
16
| Taro CLI 3.3.19 environment info:
System:
OS: macOS 11.2.3
Shell: 5.8 - /bin/zsh
Binaries:
Node: 14.16.1 - ~/.nvm/versions/node/v14.16.1/bin/node
Yarn: 1.22.10 - ~/.nvm/versions/node/v14.16.1/bin/yarn
npm: 6.14.12 - ~/.nvm/versions/node/v14.16.1/bin/npm
npmPackages:
@tarojs/components: 3.3.19 => 3.3.19
@tarojs/mini-runner: 3.3.19 => 3.3.19
@tarojs/runtime: 3.3.19 => 3.3.19
@tarojs/taro: 3.3.19 => 3.3.19
@tarojs/webpack-runner: 3.3.19 => 3.3.19
babel-preset-taro: 3.3.19 => 3.3.19
eslint-config-taro: 3.3.19 => 3.3.19
|
项目下载
1、echarts4taro3:Download ZIP
2、Use Git or checkout with SVN using the web URL.
1
| git clone https://github.com/beezen/echarts4taro3.git
|
快速开始
方式一:npm 依赖安装
1
2
| yarn add echarts4taro3 -S
|
1
| import { EChart } from "echarts4taro3";
|
方式二:可以拷贝项目中 ec-canvas 跨端组件到业务项目中直接使用
1
2
3
4
5
6
7
8
9
|
.
├── components
│ └── ec-canvas
│ ├── ec-canvas
│ └── echart
└── pages
├── ecchart
└── index
|
代码示例如下:
1
2
3
4
5
6
7
8
9
10
11
12
13
14
15
16
17
18
19
20
21
22
23
24
25
26
27
28
29
30
31
32
33
34
35
36
37
38
39
40
41
42
43
44
45
46
47
48
49
50
51
52
53
54
55
56
57
| <template>
<view class="bar-chart">
<e-chart ref="vueref0" canvas-id="bar-canvas" />
</view>
</template>
<script>
import Taro from "@tarojs/taro";
import { EChart } from "echarts4taro3";
import "./index.less";
export default {
name: "Index",
components: {
EChart,
},
data() {
return {};
},
mounted() {
let option = {
tooltip: {
trigger: "axis",
axisPointer: {
type: "shadow",
},
},
xAxis: {
type: "category",
data: ["Mon", "Tue", "Wed", "Thu", "Fri", "Sat", "Sun"],
},
yAxis: {
type: "value",
},
series: [
{
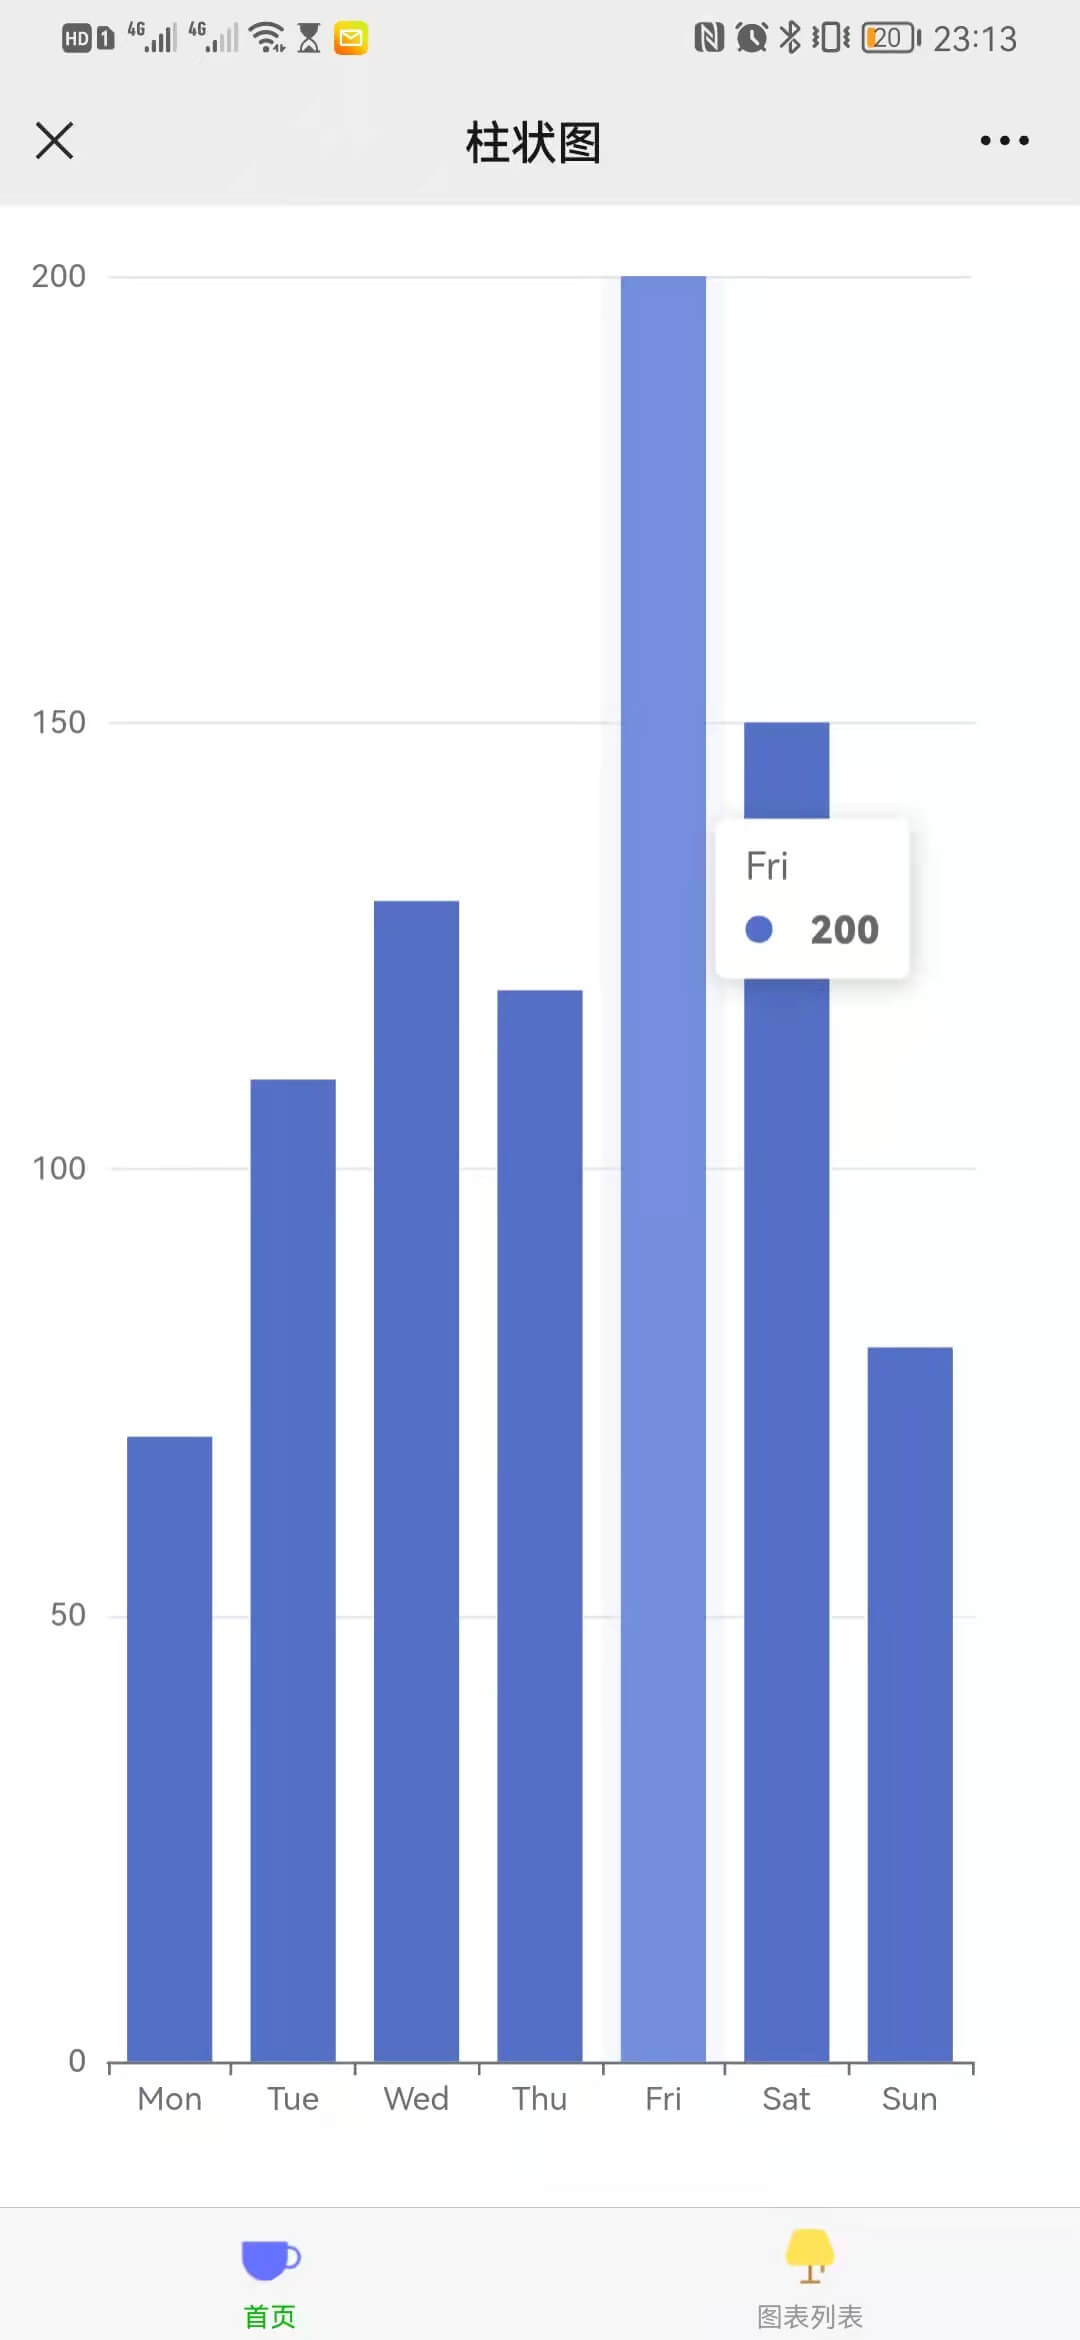
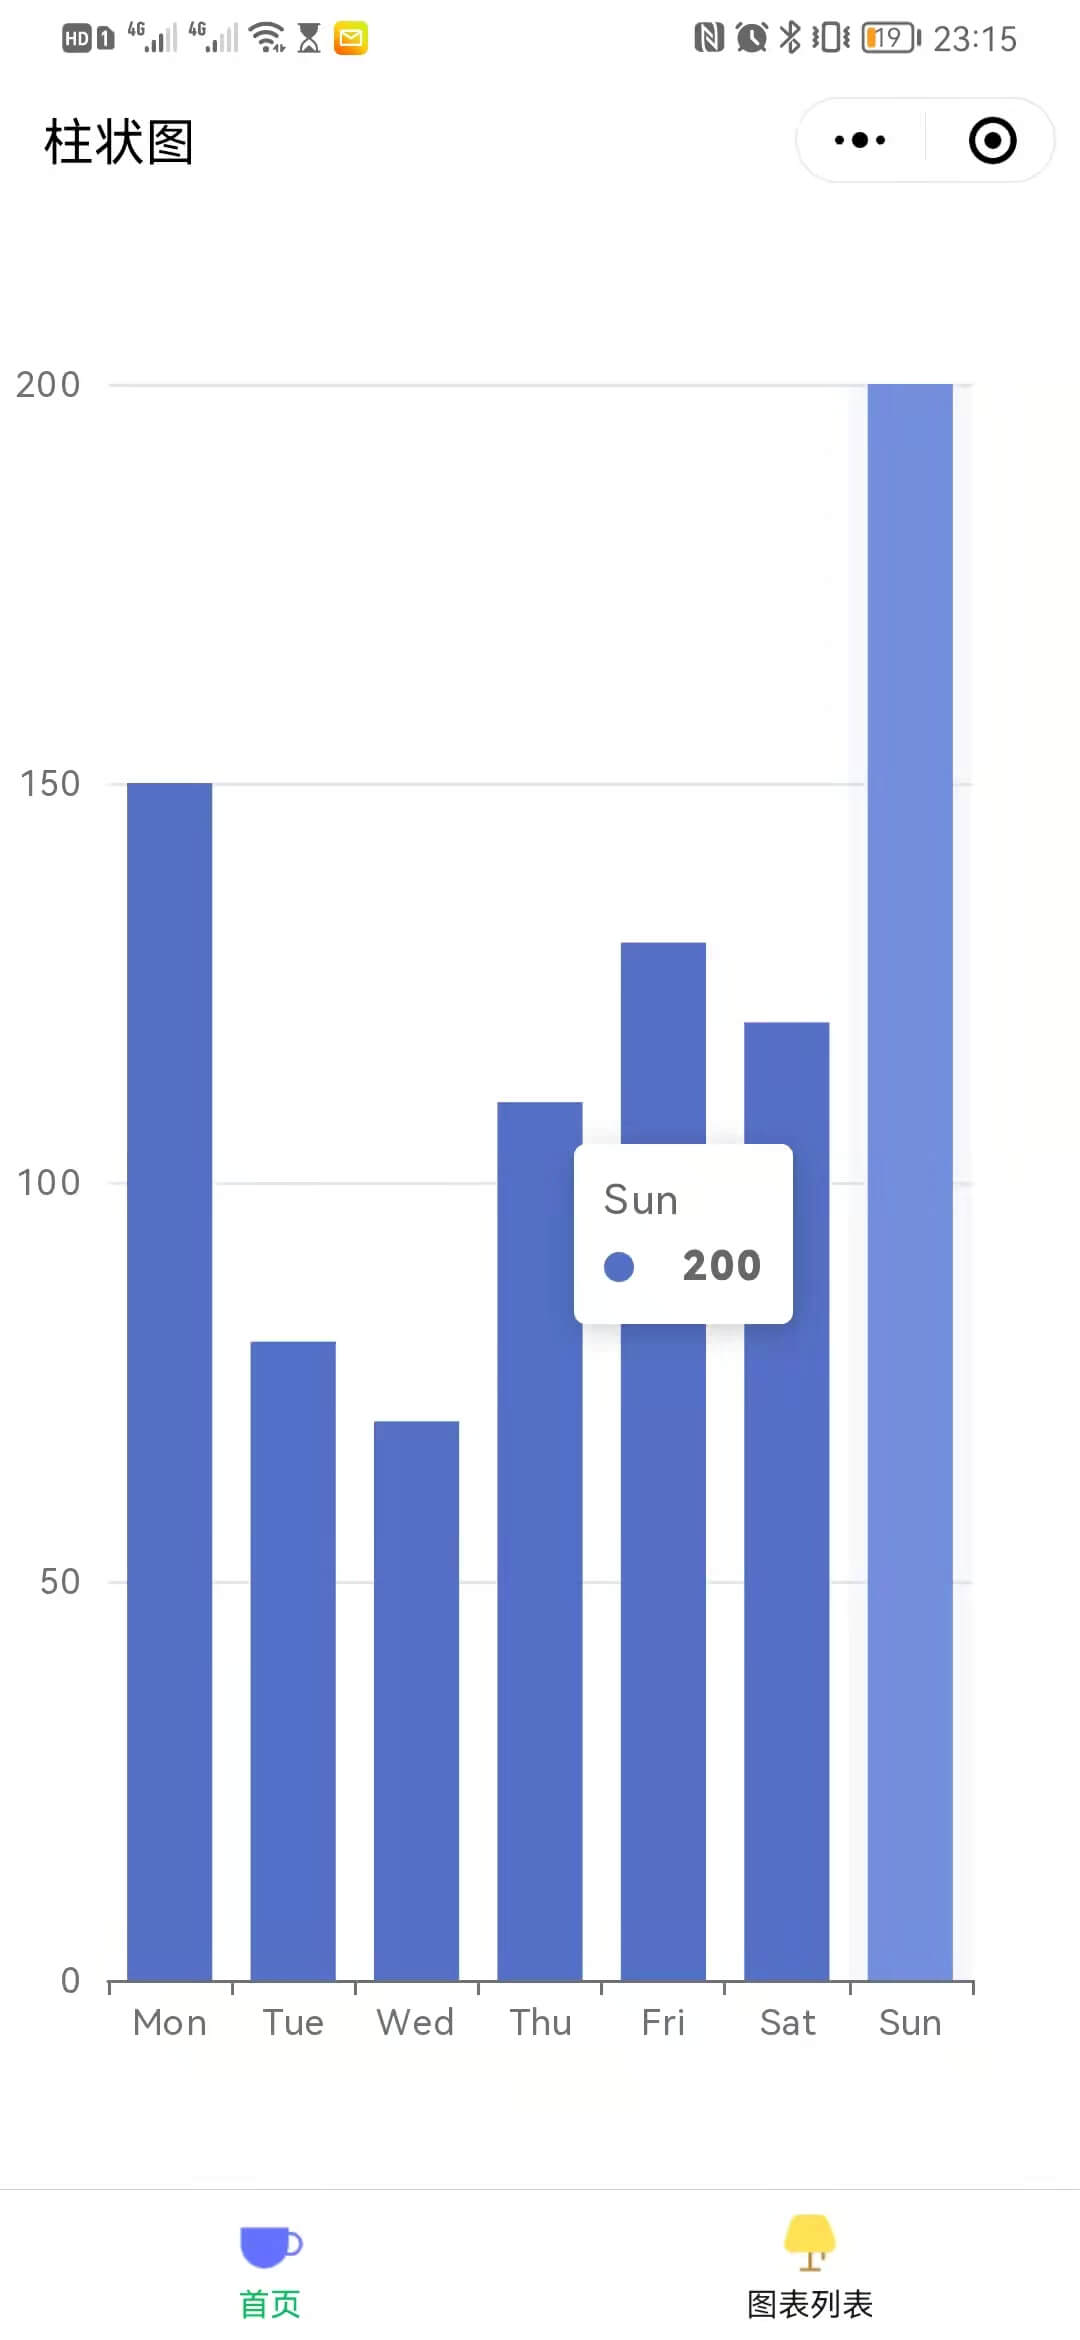
data: [120, 200, 150, 80, 70, 110, 130],
type: "bar",
},
],
};
Taro.nextTick(() => {
setTimeout(() => {
this.$refs.vueref0.refresh(option);
setInterval(() => {
let firstValue = option.series[0].data.shift();
option.series[0].data.push(firstValue);
this.$refs.vueref0.setOption(option);
}, 2000);
}, 200);
});
},
};
</script>
|
注:因 echarts 本身体积较大,可以根据业务需要在 echarts 官网定制 对应的 echarts.js,只需替换 ec-canvas 组件目录中 echarts.js 文件即可正常使用。
核心 API
引入 EChart 组件后,拿到 EChart 组件实例,并调用实例 refresh(option)方法设置图表数据,option 格式参照 echarts 官网
1
2
3
4
5
| this.$refs.vueref0.refresh(option);
this.$refs.vueref0.setOption(option);
this.$refs.vueref0.getChart();
|
效果图
参考资料